Insulation
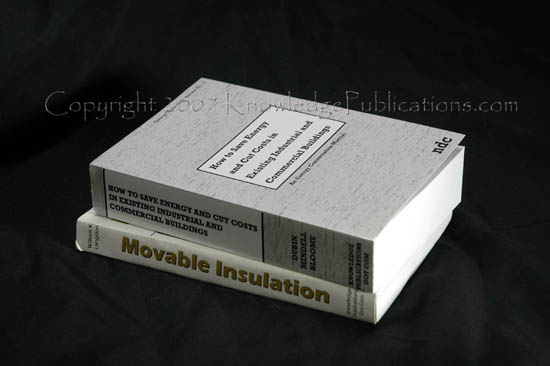
How to Save Energy and Cut Costs in Existing Industrial and Commercial Buildings. $79.95
This book was written specifically for building managers and corporations. At 725 pages, this book covers a wide range of energy conservation opportunities, such as relamping changes that increase lighting efficiency without modifications to luminaries or ballasts, heat reclamation via Thermal Wheels, Run-Around-Coil Systems and Air-To-Air Heat Exchangers, cooling and ventilation through Economizer Cycle Cooling, Enthalpy Cycle Cooling, Latent Evaporative Cooling and Desiccant Dehumidification, and HVAC Systems like the Dual Duct High Velocity System. This book explains in detail every single possible method of saving money in the heating, cooling, refrigeration and ventilation of BIG office buildings or factories. Many of the practical solutions offered by this fantastic Energy Conservation Manual can be implemented RIGHT AWAY for immediate energy and financial savings.
 |
How to Save Energy and Cut Costs in Existing Industrial and Commercial BuildingsAn Energy Conservation ManualThe gap between national energy supply and demand and the resulting escalation of operating costs we are now experiencing cannot be reduced or eliminated without a concerted and continuous effort to reduce the national energy consumption through the application of conservation practices. However, contrary to common belief, energy conservation does not mean sacrificing our living standards or living in a bleak utilitarian society. It can be accomplished without discomfort or sacrifice merely by the more efficient utilization of our nonrenewable energy resources. Buildings consume for heating, air conditioning, lighting, and power more than 33% of all energy used in the United States, the equivalent of 10 million barrels of oil per day. Reducing energy used in all buildings by 30% without impairing the indoor environment is a realistic possibility and is the equivalent of cutting our present oil imports by half. Most of the buildings now in use were designed and constructed when fuels and electric power were readily available and inexpensive so the need for energy conservation was not recognized. The structures and their mechanical and electrical systems were designed to minimize initial costs, not energy usage. Buildings are generally not operated efficiently, to the contrary, they are often overheated in the winter, overcooled in the summer, and overlighted, and overventilated year-round. Each year they consume increasing amounts of energy because systems and building components deteriorate as maintenance and service becomes more costly and neglected. Many thousands of energy conservation programs which have been implemented in existing commercial, institutional and residential buildings have already resulted in a reduction of their annual fuel and electricity consumption of 2050% and indicate the range of potential savings for almost all buildings now in use. This book is based on the reports prepared for the Federal Energy Administration by Dubin-Mindell-Bloome Associates. The results reported are compiled in this energy conservation manual (ECM). Part 1 of this manual (ECM-1) is directed primarily to owners, occupants, and operators of buildings. It includes a wide range of opportunities and options to save energy and operating costs through proper operation and maintenance. It also includes minor modifications to the building and mechanical and electrical systems which can be implemented promptly with little if any investment costs. The measures contained in ECM-1 would result in energy and operating cost savings of 15 to 30% based on present fuel costs. Part 2 of this manual (ECM-2) is intended for engineers, architects, and skilled building operators who are responsible for analyzing, devising, and implementing comprehensive energy conservation programs which involve additional and more complex measures than those included in ECM-1. ECM-2 includes many energy conservation measures which can result in further energy savings of 15 to 25% with an investment cost that can be recovered within 10 years through lower operating expense. The urgency of the energy crisis necessitated the immediate development of these guidelines. They should be used NOW to conserve energy, reduce operating costs and alleviate hardships as fuel and power supplies become more expensive. |
PART 1: BUILDING OWNERS AND OPERATORS MANUAL—ECM-1
INTRODUCTION AND SCOPE
SECTION 1: PRINCIPLES OF ENERGY CONSERVATION
SECTION 2: MAJOR ENERGY CONSERVATION OPPORTUNITIES PRIORITIES, EXAMPLES
Background
Priorities
Case Histories
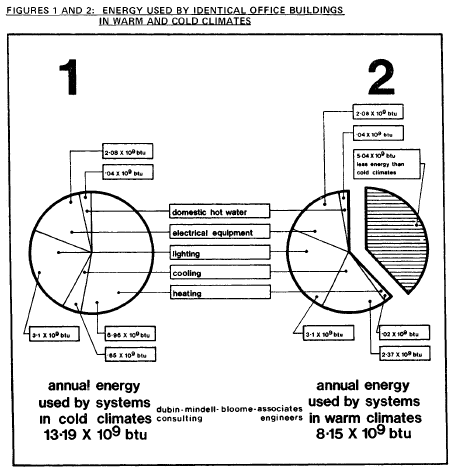
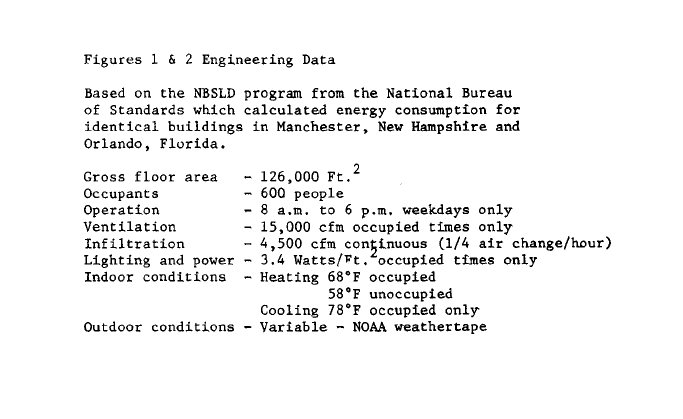
Major Energy Conservation Opportunities and Examples
Heating
Cooling
Lighting
Domestic Hot Water
SECTION 3: USE AND IMPLEMENTATION OF THE MANUAL
Background
Energy Loads
Building Load
Distribution Loads
Energy-Using Equipment Efficiency
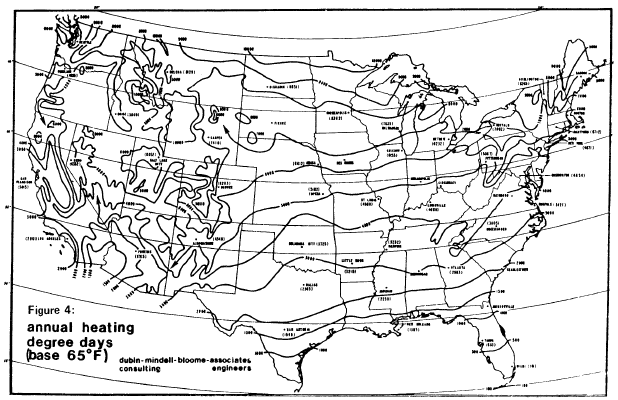
Developing the Identification Building Profiles — Energy Consumption/Parameters
 |
 |
 |
 |
 |
 |
Procedures for Implementing Detailed Conservation Opportunities
SECTION 4: ENERGY CONSERVATION OPPORTUNITIES — HEATING AND VENTILATION
Background
"Building" Heating Loads
Distribution System Loads
Primary Energy-Conversion Equipment
Energy Conservation Opportunities
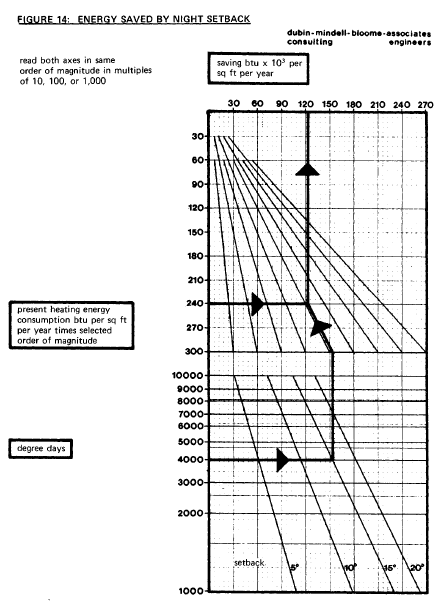
FIGURE 1114 Engineering Data
References: AFM 88-8 U.S. Government Printing Office 15 June 1967 Climatic Atlas of the United States U.S. Dept. of Commerce, June 1968
Five locations with heating degree day totals ranging from 1400-8400 were analyzed regarding time temperature distribution below 68°F DB. The percentage temperature distribution for each of the 5°F ranges which includes the setback from 68°F shown in the lower half of the Figure related to the total number of degree hours below 68°F was determined for 24 hr/day, 365 days/yr. This percentage was then plotted against annual degree days and expanded to cover the entire range of degree days and is shown as the lower half of the Figure.
The upper half of the Figure represents the range of heating energy consumed/sq.ft. for various buildings over the range of 1000 to 10,000 degree days. The extreme right hand line in the upper half represents 90% of the present consumption when projected vertically. Analysis of energy usage for heating by various buildings in several locations showed that it can be safely assumed that approximately 10% of the total heating energy consumption is during occupied hours. Therefore, savings by night setback are applicable to only 90% of the total heating energy consumption. The remainder of the upper half of the Figure simply proportions the. energy saved based on the point of entry from the lower section.
Guidelines to Reduce Energy Used in Heating
SECTION 5: ENERGY CONSERVATION OPPORTUNITIES — DOMESTIC HOT WATER
Background
Existing Conditions
Energy Conservation Opportunities
Guidelines to Reduce Energy Used for Domestic Hot Water
SECTION 6: ENERGY CONSERVATION OPPORTUNITIES — COOLING AND VENTILATION
Background
The "Building" Cooling Load
Distribution System Loads
Primary Energy Conversion Equipment
Energy Conservation Opportunities
Guidelines to Reduce Energy Used for Cooling
SECTION 7: ENERGY CONSERVATION OPPORTUNITIES — DISTRIBUTION AND HVAC SYSTEMS
Background
Energy Conservation Opportunities
Guidelines to Reduce Energy Used for Distribution and HVAC Systems
SECTION 8: ENERGY CONSERVATION OPPORTUNITIES COMMERCIAL REFRIGERATION SYSTEMS
Background
Energy Conservation Opportunities
SECTION 9: ENERGY CONSERVATION OPPORTUNITIES — LIGHTING
Background
Energy Conservation Opportunities
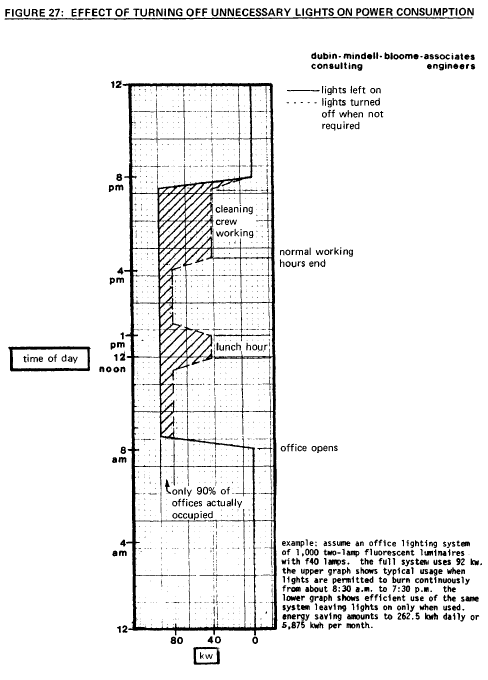
Figure 128 Engineering Data
Reference: I.E.S. Lighting Handbook, 4th edition 1968, page 9-17, figure 9-7 Illuminating Engineering Society 345 East 47th Street, New York, N.Y.
The data is computed from actual measurements of lumen output from lamps and fixtures exposed to various environments for different lengths of time.
Guidelines to Reduce Energy Used for Lighting
SECTION 10: ENERGY CONSERVATION OPPORTUNITIES — POWER
Background
Energy Conservation Opportunities
Guidelines to Reduce Energy Used for Power
APPENDIX A: COST INDICES
APPENDIX B: ENERGY CONSERVATION EXAMPLE
PART 2: ENGINEERS, ARCHITECTS, AND OPERATORS MANUALECM-2
INTRODUCTION AND SCOPE
SECTION 11: ESTABLISH AN ENERGY MANAGEMENT PROGRAM
Purpose
The Team
Procedure
SECTION 12: ENERGY CONSERVATION OPPORTUNITIES — MECHANICAL SYSTEMS BACKGROUND
SECTION 13: ENERGY CONSERVATION OPPORTUNITIES — HEATING AND VENTILATION
Energy Conservation Opportunities
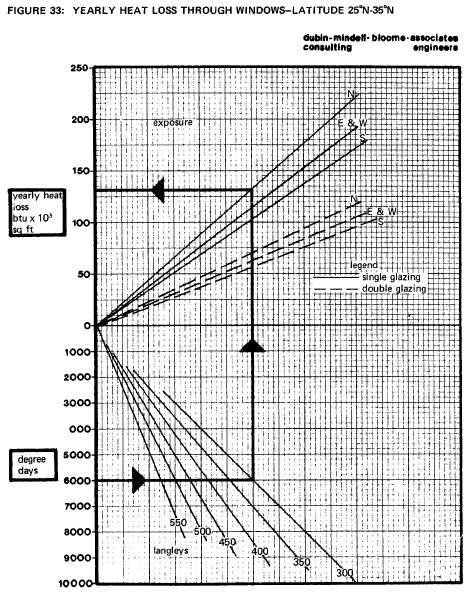
Figure #33 Engineering Data
This figure is based on the "Sunset" computer program which was used to calculate solar effect on windows for 12 selected locations. The program calculates hourly solar angles and intensities for the 21st day of each month. Radiation intensity values were modified by the average percentage of cloud cover taken from weather records on an hourly basis. Heat losses are based on a 68° indoor temperature.
Additional assumptions were: 1) Total internal heat gain of 12 Btu/sq. ft. 2) Average outdoor air ventilation rate of 10%. 3) Infiltration rate of 1/2 air change per hour. Daily totals were then summed for the number of days in each month to arrive at monthly heat losses. The length of the heating season for each location considered was determined from weather data and characteristic operating periods. Yearly heat losses were derived by summing monthly totals for the length of the heating season. These are summarized in Figure #32 for the 12 locations. The data was then plotted and extrapolated to include the entire range of degree days. Figure #33 was derived from locations with latitudes between 25°N - 35°N.
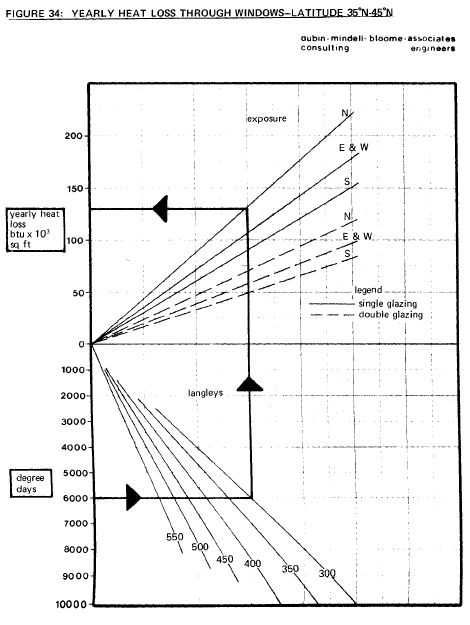
Figure #34 Engineering Data
This figure is based on the "Sunset" computer program which was used to calculate solar effect on windows for 12 selected locations. The program calculates hourly solar angles and intensities for the 218t day of each month. Radiation intensity values were modified by the average percentage of cloud cover taken from weather records on an hourly basis. Heat losses are based on a 68° indoor temperature.
Additional assumptions were: 1) Total internal heat gain of 12 Btu/sq. ft. 2) Average outdoor air ventilation rate of 10%. 3) Infiltration rate of 1/2 air change per hour. Daily totals were then summed for the number of days in each month to arrive at monthly heat losses. The length of the heating season for each location considered was determined from weather data and characteristic operating periods. Yearly heat losses were derived by summing monthly totals for the length of toe heating season. These are summarized in Figure #32 for the 12 locations. The data was then plotted and extrapolated to include the entire range of degree days. Figure #34 was derived from locations with latitudes between 35°N - 45°N.
Guidelines to Reduce Energy Used for Heating
SECTION 14: ENERGY CONSERVATION OPPORTUNITIES — DOMESTIC HOT WATER
Energy Conservation Opportunities
Guidelines to Reduce Energy Used for Domestic Hot Water Systems
SECTION 15: ENERGY CONSERVATION OPPORTUNITIES — COOLING AND VENTILATION
Energy Conservation Opportunities
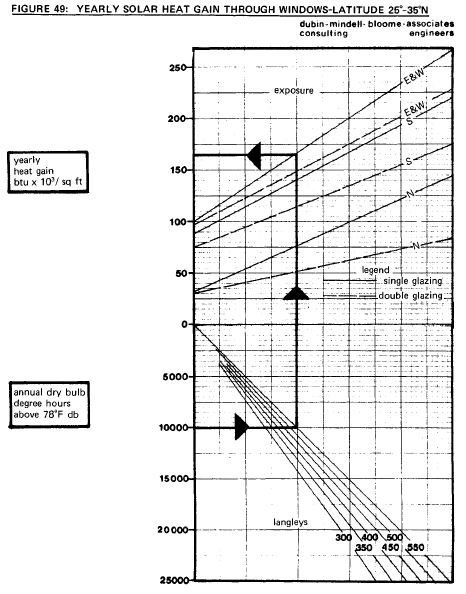
Figure #49 Engineering Data
This figure is based on the "Sunset" Computer program which was used to calculate solar effect on windows for 12 locations. The program calculates hourly solar angles and intensities for the 21st day of each month. Radiation intensity values were modified by the average percentage of cloud cover taken from weather records on an hourly basis. Heat gains are based on a 78°F indoor temperature. During the cooling ,season, internal gains, ventilation, infiltration and conduction through the building cat create a cooling load. The additional load caused by heat gain through the windows was calculated for each day. Daily totals were then summed for the number of days in each month to arrive at monthly heat gain. The length of the cooling season for each location considered was determined from weather data and characteristic operating periods. Yearly heat gains were derived by summing monthly totals for the length of the cooling season. These are summarized in Figure #48 for the 12 locations. Gains in Figure the conduction heat gain component through windows read from Figure #51 were deducted from the total heat gains to derive the solar component. The solar component was then plotted and extrapolated to include the entire range of degree hours. Figure #49 was derived from locations with latitudes between 25°N - 35°N. The heat gains assume that the windows are subjected to direct sunshine. If shaded, gains should be read from the north exposure line. The accuracy of the graph diminishes for location with less than 5,000 degree hours.
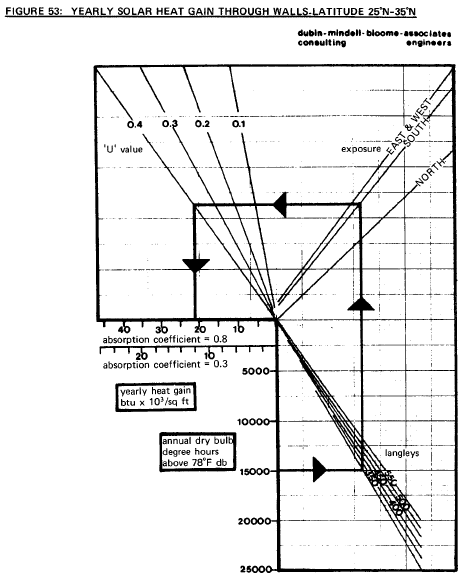
Figure #53 Engineering Data
This figure is based on the "Sunset" computer program which was used to calculate solar effect on walls for 12 selected locations. The program calculates hourly solar angles and intensities for the 21st day of each month. Radiation intensity values were modified by the average percentage of cloud cover taken from weather records on an hourly basis. Heat gains are based on a 78°F indoor temperature.
The solar effect on a wall was calculated using sol-air temperature and the heat entering or leaving a space was calculated with the equivalent temperature difference. Wall mass ranged from 50 - 60 lbs/sq.ft. and thermal lag averaged 4 1/2 hours. During the cooling season internal gains, ventilation, infiltration and conduction through the building skin create a cooling load. The additional load caused by heat going through the walls was calculated for each day. Daily totals were then summed for the number of days in each month to arrive at monthly heat gains. The length of the cooling season for each location considered was determined from weather data and characteristic operating periods. Yearly heat gains were derived by summing monthly totals for the length of the cooling season.
Absorption coefficients and 'U' values were varied and summarized for the 12 locations as shown in Figure #52. Gains in Figure #52 include both the solar and conduction components of heat gain. Values of the conduction heat gain component through walls were deducted from the total heat gain to derive the solar component. The solar component was then plotted and extrapolated to include the entire range of degree hours. Figure #53 was derived from locations with latitudes between 25°N - 35°N. The heat gains assume that the walls are subjected to direct sunshine. If shaded, gain should be read intersecting with the North exposure line.
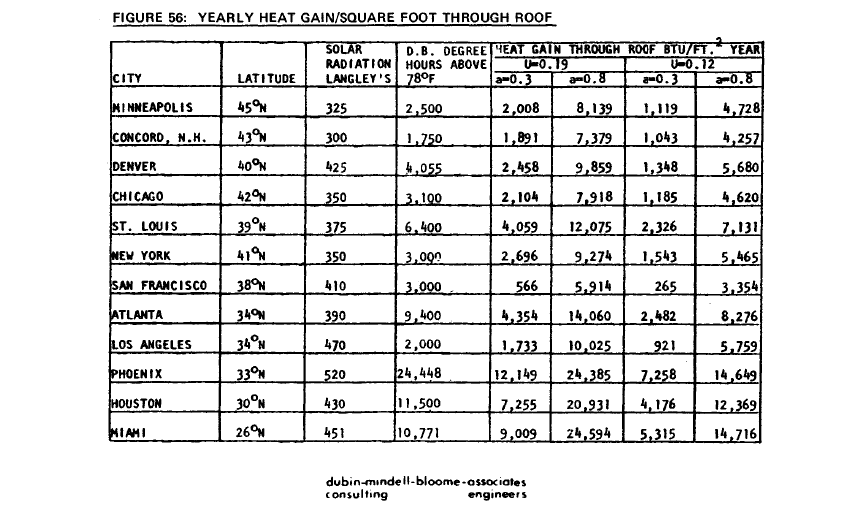
Guidelines to Reduce Energy Used for Cooling and Ventilation
SECTION 16: ENERGY CONSERVATION OPPORTUNITIES COMMERCIAL REFRIGERATION
Energy Conservation Opportunities
Guidelines to Reduce Energy Used for Commercial Refrigeration
SECTION 17: ENERGY CONSERVATION OPPORTUNITIES DISTRIBUTION AND HVAC SYSTEMS
Background
Energy Conservation Opportunities
Guidelines to Reduce Energy Used for Distribution and HVAC Systems
Discussion of HVAC Systems
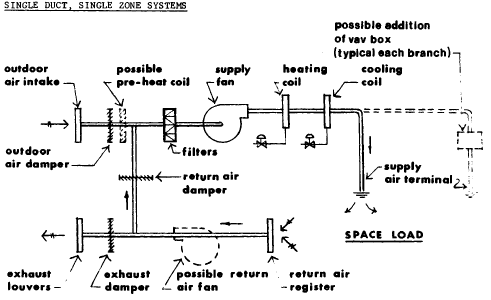
Representative single duct systems are the simplest and probably the most commonly used. They can comprise just a single supply system with air intake filters, supply fan and heating coil or can become more complex with the addition of a return air duct, return air fan, cooling coil, and various controls to optimize their performance. Basically, the system supplies air at a pre-determined temperature to one zone or the entire building, the quantity of heating or cooling being controlled either by modulating the supply air temperature or by turning the system on and off.
The energy output of a single duct system to meet a space load is determined by the volume/temperature differential relationship, i.e., to maintain a space temperature of 65°F, the heating load could be met by a system supplying 10,000 cfm at 105°F, or 6,000 cfm at 125°F.
To conserve energy in single zone, single duct systems, determine from measurements the system output and the building load. In the heating mode, if the system maximum output exceeds design building load, first reduce the volume of system air as this will show the greatest energy saving, i.e., 90% of the original fan volume requires only 65% of the original fan HP. Next reduce the supply temperature; this will not conserve as much energy as reduced volume flow.
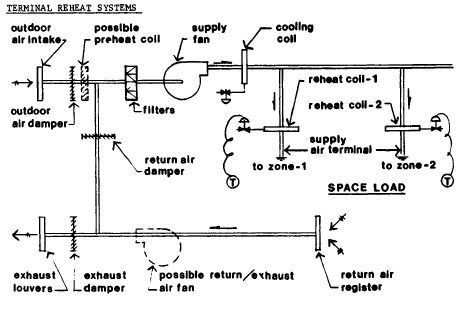
Terminal reheat systems were developed to overcome the zoning deficiencies of single duct systems and basically comprise a single duct, single zone system with individual heating coils in each branch duct to zones of similar loads. Reheat systems were also developed to give closer control of relative humidity in selected spaces.
Terminal reheat allows each different zone to be individually controlled but wastes energy in the cooling season as all of the supply air must be cooled to a low enough temperature to meet most critical load zone but must be reheated for zones of lesser loads to avoid overcooling.
As with single duct systems, energy can be conserved by reducing the supply air volume. Many reheat systems are controlled at a fixed supply temperature of around 55°DB/55°WB. To conserve energy, fit controls to reschedule the supply air temperature upward according to demands of the zone with the greatest cooling load. If one zone has cooling loads grossly in excess of all others, the controlling thermostat should be located in that space.
The greatest quantity of energy can be saved by adding variable air volume boxes to each of the major branch ducts. Each VAV box should be controlled by a space thermostat located in its particular zone and its associated reheat coil should be provided with controls to prevent reheat until the VAV box has reduced the zone supply air volume to 50%.

Most multi-zone units currently installed have a single heating coil serving the hot deck and single cooling coil serving cold deck. Each zone supply temperature is adjusted by mixing the required quantities of hot and cold air from these coils. With these types of units, the hot deck temperature must be sufficiently high to meet the heating demands of the coldest zone,and cold deck air must be sufficiently low to meet the demands of the hottest zone. All intermediate zones are supplied with a mixture of hot and cold air wasting energy in a similar manner to reheat systems.
New model multi-zone units are now available on the market which have individual heating and cooling coils for each zone supply duct and the supply air is heated or cooled only to that degree required to meet the zone load. These new types of units use far less energy than units with common coils and where renovations are contemplated or the existing multi-zone unit is at or near the end of its useful life, replacement should be considered, using a multi-zone unit with individual zone coils.
Analyze multi-zone systems carefully and treat each zone as a single zone system and adjust air volumes and temperature accordingly.
SECTION 18: ENERGY CONSERVATION OPPORTUNITIES — HEAT RECLAMATION
Background
Available Heat Reclamation Equipment
Energy Conservation Opportunities
SECTION 19: ENERGY CONSERVATION OPPORTUNITIES LIGHTING
Background
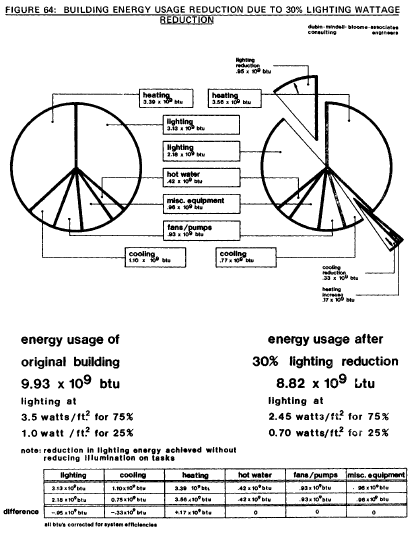 |
Figure #64 - Engineering Data Computer Run at Average Lighting of 2.875 W/ft2 a. Building 135' x 115' located with long axis N-S b. 8 floors 13'-0" floor to floor, 9'-0" floor to ceiling c. 5 zones/floor (four perimeter - one central) 15'-0" wide solid panels at North Face - NE corner and NW corner East Face - SE corner West Face - SW corner lighting - 3.5 W/ft2 for 75% floor area 1.0 W/ft2 for 25% floor area f. Power - 0.5 W/ft2 for 100% floor area g. Occupancy - 600 people 8 a.m. - 6 p.m. weekdays (except holidays) h. Ventilation - 15,000 cfm outdoor air when occupied i. Infiltration - 1/4 air change/hour constant j. Indoor Conditions - 70°F, 30% RH October thru May when occupied 600F,42% RH October thru May when unoccupied 75°F,50 RH June thru September k. Equipment Loads - Ventilating Fans - 37 KW when occupied Domestic Hot Water - 100,000 Btu/W when occupied Pumps - June thru September,27 KW when occupied October thru May,27 KW 24/hours/day Other Equipment - 60 HP when occupied 1. Seasonal Efficiencies - Heating = 60% Cooling - COP 2.5 m. Building Parameters 1. Walls - U = 0.06 Absorptivity - 0.9 2. Floor - U = 0.06 3. Roof - U = 0.06 50% of area covered by equipment rooms 4. Windows - double pane, clear glazing U = 0.65 5. Window/wall ratio 10% of wall exposed to room 6. Solar shading - No direct sun on windows March thru September. No cooling allowed when building is unoccupied. No heating allowed June thru September. |
Energy Conservation Opportunities
Guidelines to Reduce Energy Used for Lighting
SECTION 20: ENERGY CONSERVATION OPPORTUNITIES — POWER
Background
Energy Conservation Opportunities
CORRECT POWER FACTOR
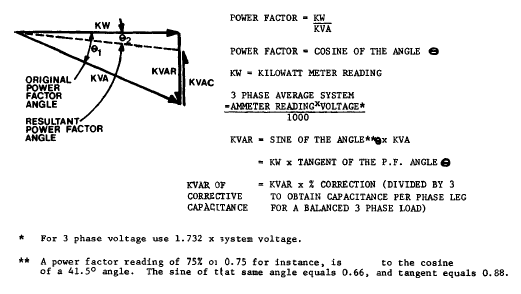
Low power factor (P.F.) increases losses in electrical distribution and utilization equipment such as wiring, motors,and transformers, and reduces the load handling capability and voltage regulation of the building electrical system. At a unity power factor, P.F. losses are at a minimum. When P.F. is below a designated level, utilities often have a provision for a separate additional penalty charge, although the methods of computing the charge vary, the magnitude is about the same. As an example, one utility company charges a penalty of $0.25 per kilowatt-ampere reactive (KVAR) over 50% of total KW demand. Poor power factor also reduces the capacity of the electrical service. Even with a P.F. of 80% electrical service spare capacity is decreased by an additional 25% of the load, and transmission losses are increased by 56% when compared to unity P.F.
Power factor is the ratio of actual power (KW) to apparent (KVA); it also may be expressed as the cosine of the phase angle between the impressed voltage and the current. The following diagram shows the relationship between P.F., KW, KVAR and KVA and indicates the effect of corrective capacitance.
Guidelines to Reduce Energy Used for Electric Power
SECTION 21: CENTRAL CONTROL SYSTEMS
SECTION 22: ALTERNATIVE ENERGY SOURCES
Background
Solar Energy
Domestic Hot Water Heating
Space Heating and Cooling
Other Systems to Utilize Solar Energy
Electric Power
Total Energy Systems
Background
Guidelines for Selecting Buildings Where TE Systems May Prove Feasible
Preparing an Engineering and Economic Feasibility Analysis
Other Considerations for TE Plants
SECTION 23: COST ESTIMATES AND ECONOMIC ANALYSIS
Cost Estimates
Economic Analysis
SECTION 24: COMPUTER PROGRAMS FOR ENERGY ANALYSIS
Background
Program Types
Program Inputs
Program Outputs
Program Selection
Future Developments
APPENDIX A: SELECTED CODES AND STANDARDS
APPENDIX B: COST DATA
APPENDIX C: ECONOMIC MODEL AND EXAMPLE
APPENDIX D: SOURCES FOR COMPUTER PROGRAMS TO CALCULATE LOADS AND ENERGY USE
APPENDIX E: ENERGY CONSERVATION EXAMPLE
GLOSSARY
ABBREVIATIONS
BIBLIOGRAPHY AND SELECTED REFERENCES
INDEX

How to Save Energy and Cut Costs in Existing Industrial and Commercial Buildings. $79.95
This book was written specifically for building managers and corporations. At 725 pages, this book covers a wide range of energy conservation opportunities, such as relamping changes that increase lighting efficiency without modifications to luminaries or ballasts, heat reclamation via Thermal Wheels, Run-Around-Coil Systems and Air-To-Air Heat Exchangers, cooling and ventilation through Economizer Cycle Cooling, Enthalpy Cycle Cooling, Latent Evaporative Cooling and Desiccant Dehumidification, and HVAC Systems like the Dual Duct High Velocity System. This book explains in detail every single possible method of saving money in the heating, cooling, refrigeration and ventilation of BIG office buildings or factories. Many of the practical solutions offered by this fantastic Energy Conservation Manual can be implemented RIGHT AWAY for immediate energy and financial savings.


