DOE Fundamentals Handbook - Nuclear Physics and Reactor Theory
DOE Fundamentals Handbook - Nuclear Physics and Reactor Theory
The Nuclear Physics and Reactor Theory Fundamentals Handbook contains elaborate discussions on Atomic and Nuclear Physics, Neutron Characteristics, Reactor Theory and Nuclear Parameters and the Theory of Reactor Operation. The information in the handbook is presented to provide a foundation for applying engineering concepts. It presents more than enough information to provide YOU with a fundamental knowledge level sufficient to really understand basic concepts of atomic physics, including the atomic nature of matter, Radioactive Decay, fission, the Neutron Life Cycle, Reactor Kinetics, as well as the interaction of radiation with matter and much, much more.
 |
DOE FUNDAMENTALS HANDBOOKNUCLEAR PHYSICS AND REACTOR THEORY VOLUMES 1-2
|
Volume 1 of 2
Module 1 - Atomic and Nuclear Physics
-Explanation- This module Introduces concepts of atomic physics including the atomic nature of matter, the chart of the nuclides, radioactivity and radioactive decay, neutron interactions and fission, and the interaction of radiation with matter.
ATOMIC NATURE OF MATTER
Structure of Matter
Subatomic Particles
Bohr Model of the Atom
Bohr Model of the Atom
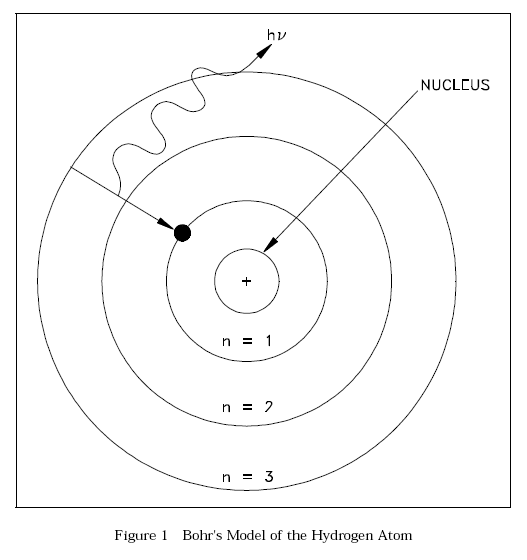
The British physicist Ernest Rutherford postulated that the positive charge in an atom is concentrated in a small region called a nucleus at the center of the atom with electrons existing in orbits around it. Niels Bohr, coupling Rutherford's postulation with the quantum theory introduced by Max Planck, proposed that the atom consists of a dense nucleus of protons surrounded by electrons traveling in discrete orbits at fixed distances from the nucleus. An electron in one of these orbits or shells has a specific or discrete quantity of energy (quantum). When an electron moves from one allowed orbit to another allowed orbit, the energy difference between the two states is emitted or absorbed in the form of a single quantum of radiant energy called a photon. Figure 1 is Bohr's model of the hydrogen atom showing an electron as having just dropped from the third shell to the first shell with the emission of a photon that has an energy = hv. (h = Planck's constant = 6.63 x 10⁻³⁴ J-s and v = frequency of the photon.) Bohr's theory was the first to successfully account for the discrete energy levels of this radiation as measured in the laboratory. Although Bohr's atomic model is designed specifically to explain the hydrogen atom, his theories apply generally to the structure of all atoms. Additional information on electron shell theory can be found in the Chemistry Fundamentals Handbook
Measuring Units on the Atomic Scale
Nuclides
Isotopes
Atomic and Nuclear Radii
Nuclear Forces
Summary
CHART OF THE NUCLIDES
Chart of the Nuclides
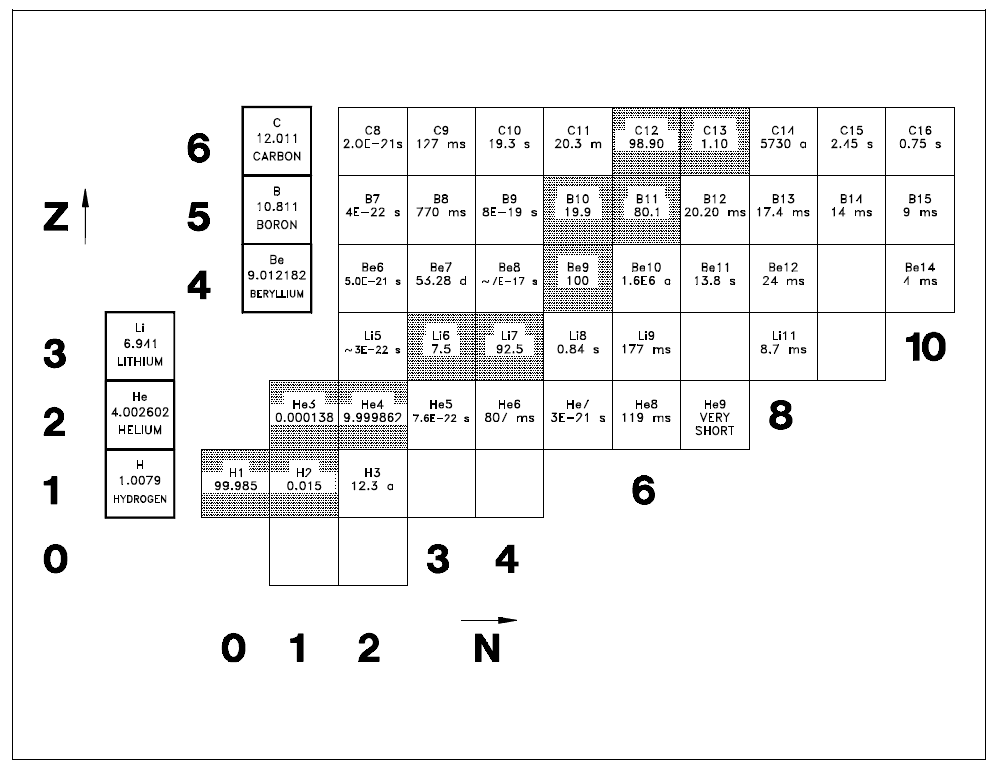
Chart of the NuclidesA tabulated chart called the Chart of the Nuclides lists the stable and unstable nuclides in addition to pertinent information about each one. Figure 3 shows a small portion of a typical chart. This chart plots a box for each individual nuclide, with the number of protons (Z) on the vertical axis and the number of neutrons (N = A - Z) on the horizontal axis. The completely gray squares indicate stable isotopes. Those in white squares are artificially radioactive, meaning that they are produced by artificial techniques and do not occur naturally. By consulting a complete chart, other types of isotopes can be found, such as naturally occurring radioactive types (but none are found in the region of the chart that is illustrated in Figure 3). Located in the box on the far left of each horizontal row is general information about the element. The box contains the chemical symbol of the element in addition to the average atomic weight of the naturally occurring substance and the average thermal neutron absorption cross section, which will be discussed in a later module. The known isotopes (elements with the same atomic number Z but different mass number A) of each element are listed to the right. |
Information for Stable Nuclides
Information for Unstable Nuclides
Neutron - Proton Ratios
Natural Abundance of Isotopes
Enriched and Depleted Uranium
Summary
MASS DEFECT AND BINDING ENERGY
Mass Defect
Binding Energy
Energy Levels of Atoms
Energy Levels of the Nucleus
Energy Levels of the Nucleus
The nucleons in the nucleus of an atom, like the electrons that circle the nucleus, exist in shells that correspond to energy states. The energy shells of the nucleus are less defined and less understood than those of the electrons. There is a state of lowest energy (the ground state) and discrete possible excited states for a nucleus. Where the discrete energy states for the electrons of an atom are measured in eV or keV, the energy levels of the nucleus are considerably greater and typically measured in MeV.
A nucleus that is in the excited state will not remain at that energy level for an indefinite period. Like the electrons in an excited atom, the nucleons in an excited nucleus will transition towards their lowest energy configuration and in doing so emit a discrete bundle of electromagnetic radiation called a gamma ray (ã-ray). The only differences between x-rays and ã-rays are their energy levels and whether they are emitted from the electron shell or from the nucleus.
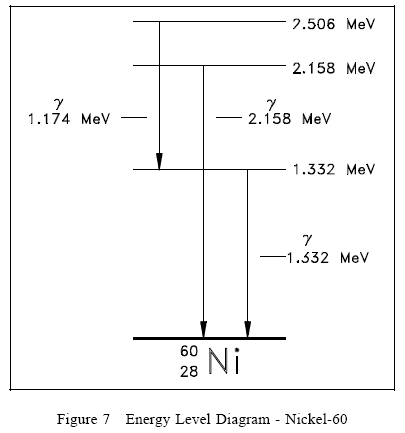
The ground state and the excited states of a nucleus can be depicted in a nuclear energy-level diagram. The nuclear energy-level diagram consists of a stack of horizontal bars, one bar for each of the excited states of the nucleus. The vertical distance between the bar representing an excited state and the bar representing the ground state is proportional to the energy level of the excited state with respect to the ground state. This difference in energy between the ground state and the excited state is called the excitation energy of the excited state. The ground state of a nuclide has zero excitation energy. The bars for the excited states are labeled with their respective energy levels. Figure 7 is the energy level diagram for nickel-60.
Summary
MODES OF RADIOACTIVE DECAY
Stability of Nuclei
Natural Radioactivity
Nuclear Decay
Alpha Decay (α)
Beta Decay (β)
Electron Capture (EC, K-capture)
Gamma Emission (γ)
Internal Conversion
Isomers and Isomeric Transition
Decay Chains
Predicting Type of Decay
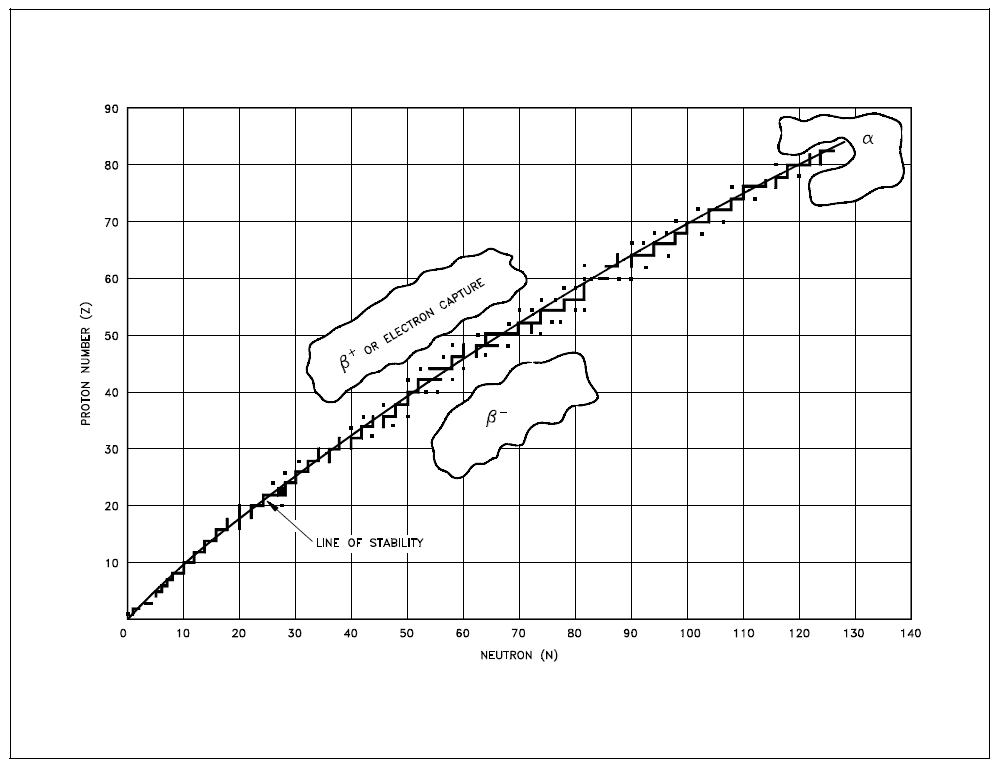
Predicting Type of DecayRadioactive nuclides tend to decay in a way that results in a daughter nuclide that lies closer to the line of stability. Due to this, it is possible to predict the type of decay that a nuclide will undergo based on its location relative to the line of stability on the Chart of the Nuclides. Figure 9 illustrates the type of decay nuclides in different regions of the chart will typically undergo. Nuclides that are below and to the right of the line of stability will usually undergo (3- decay. Nuclides that are above and to the left of the line of stability will usually undergo either R+ decay or electron capture. Most nuclides that will undergo a decay are found in the upper right hand region of the chart. These are general rules that have many exceptions, especially in the region of the heavy nuclides. |
Summary
RADIOACTIVITY
Radioactive Decay Rates
Units of Measurement for Radioactivity
Variation of Radioactivity Over Time
Radioactive Half-Life
Plotting Radioactive Decay
Radioactive Equilibrium
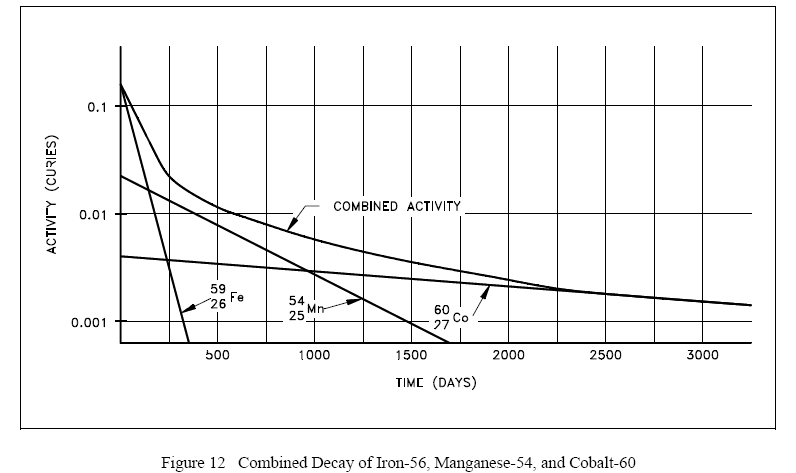
Plotting the manner in which the activities of each of the three nuclides decay over time demonstrates that initially the activity of the shortest-lived nuclide (iron-59) dominates the total activity, then manganese-54 dominates. After almost all of the iron and manganese have decayed away, the only contributor to activity will be the cobalt-60. A plot of this combined decay is shown in Figure 12.
Transient Radioactive Equilibrium
Summary
NEUTRON INTERACTIONS
Scattering
Elastic Scattering
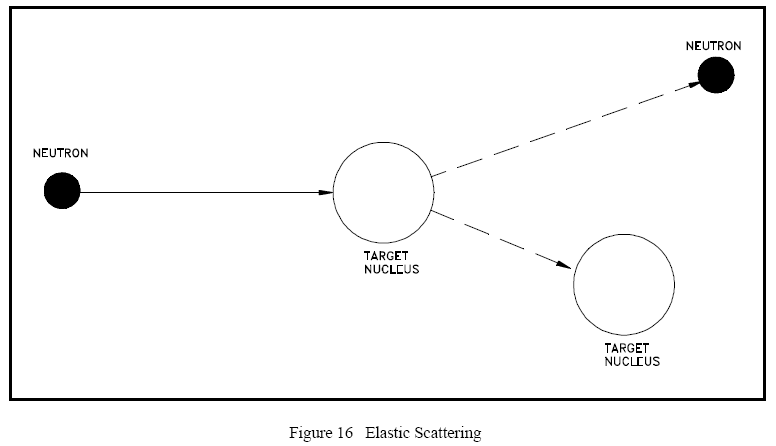
Figure 16 illustrates the process of elastic scattering of a neutron off a target nucleus. In the elastic scattering reaction, the conservation of momentum and kinetic energy is represented by the equations below. ½
Conservation of momentum ( mv )
( mn vn,i ) + ( mT vT,i ) = ( mn vn,f ) + ( mT vT,f )
Conservativation of kinetic energy ( ½ m v2 )
( ½ mn v2n,i ) + ( ½ mT v2n,f ) + ( ½mT v2T,f )
Inelastic Scattering
Absorption Reactions
Radiative Capture
Particle Ejection
Fission
Summary
NUCLEAR FISSION
Fission
Liquid Drop Model of a Nucleus
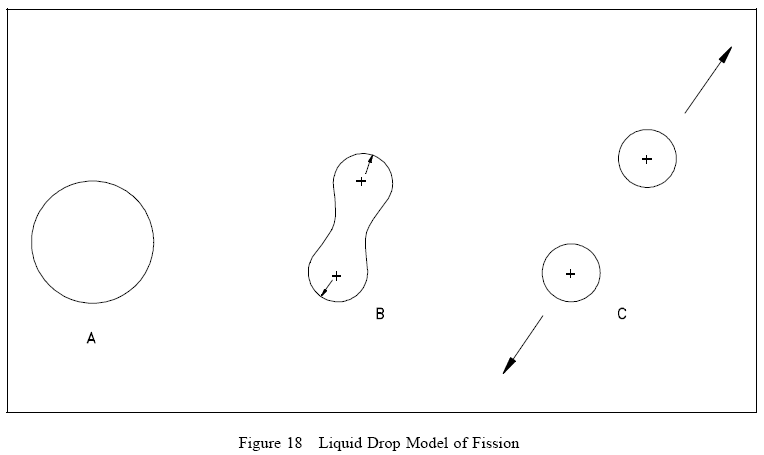
Referring to Figure 18(A), the nucleus in the ground state is undistorted, and its attractive nuclear forces are greater than the repulsive electrostatic forces between the protons within the nucleus. When an incident particle (in this instance a neutron) is absorbed by the target nucleus, a compound nucleus is formed. The compound nucleus temporarily contains all the charge and mass involved in the reaction and exists in an excited state. The excitation energy added to the compound nucleus is equal to the binding energy contributed by the incident particle plus the kinetic energy possessed by that particle. Figure 18(B) illustrates the excitation energy thus imparted to the compound nucleus, which may cause it to oscillate and become distorted. If the excitation energy is greater than a certain critical energy, the oscillations may cause the compound nucleus to become dumbbell-shaped. When this happens, the attractive nuclear forces (short-range) in the neck area are small due to saturation, while the repulsive electrostatic forces (long-range) are only slightly less than before. When the repulsive electrostatic forces exceed the attractive nuclear forces, nuclear fission occurs, as illustrated in Figure 18(C).
Critical Energy
Fissile Material
Fissionable Material
Fertile Material
Binding Energy Per Nucleon (BE/A)
Summary
ENERGY RELEASE FROM FISSION
Calculation of Fission Energy
Estimation of Decay Energy
Distribution of Fission Energy
Summary
INTERACTION OF RADIATION WITH MATTER
Interaction of Radiation With Matter
Alpha Radiation
Beta Minus Radiation
Positron Radiation
Neutron Radiation
Gamma Radiation
Summary
Module 2 - Reactor Theory (Nuclear Parameters)
-Explanation- This module provides information on reactor theory and neutron characteristics. Includes topics such as neutron sources, neutron flux, neutron cross sections, reaction rates, neutron moderation, and prompt and delayed neutrons.
NEUTRON SOURCES
Neutron Sources
Intrinsic Neutron Sources
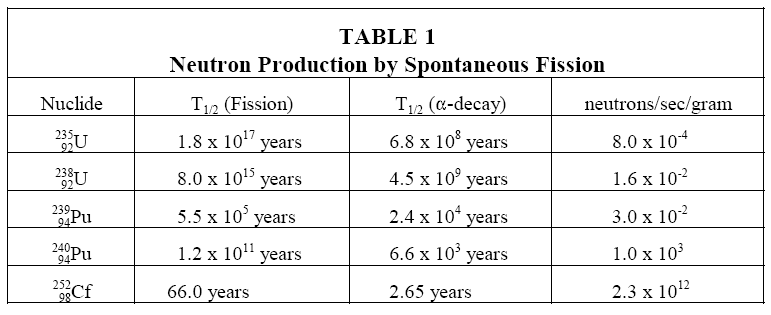
A limited number of neutrons will always be present, even in a reactor core that has never been operated, due to spontaneous fission of some heavy nuclides that are present in the fuel. Uranium-238, uranium-235, and plutonium-239 undergo spontaneous fission to a limited extent. Uranium-238, for example, yields almost 60 neutrons per hour per gram. Table 1 illustrates a comparison of the rate at which different heavy nuclides produce neutrons by spontaneous fission. Californium-252 is not an intrinsic neutron source, but will be discussed in the section on installed neutron sources.
Another intrinsic neutron source is a reaction involving natural boron and fuel. In some reactors, natural boron is loaded into the reactor core as a neutron absorber to improve reactor control or increase core life-time. Boron-11 (80.1% of natural boron) undergoes a reaction with the alpha particle emitted by the radioactive decay of heavy nuclides in the fuel to yield a neutron as shown below.
Installed Neutron Sources
Summary
NUCLEAR CROSS SECTIONS AND NEUTRON FLUX
Introduction
Atom Density
Cross Sections
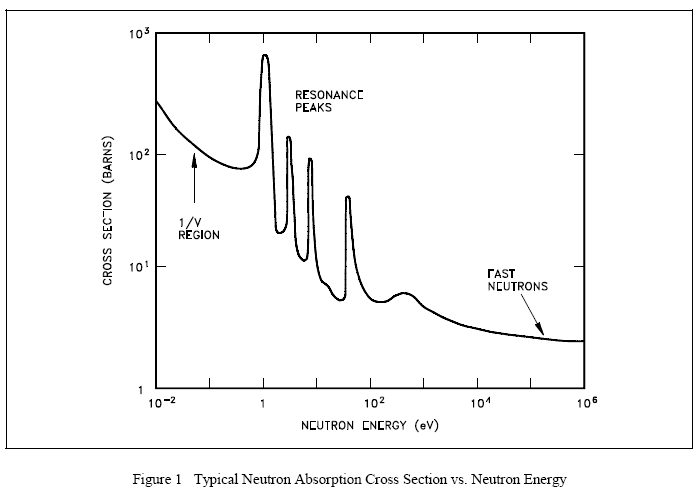
The variation of absorption cross sections with neutron energy is often complicated. For many elements the absorption cross sections are small, ranging from a fraction of a barn to a few barns for slow (or thermal) neutrons.
For a considerable number of nuclides of moderately high (or high) mass numbers, an examination of the variation of the absorption cross section with the energy of the incident neutron reveals the existence of three regions on a curve of absorption cross section versus neutron energy. This cross section is illustrated in Figure 1. First, the cross section decreases steadily with increasing neutron energy in a low energy region, which includes the thermal range (E < 1 eV). In this region the absorption cross section, which is often high, is inversely proportional to the velocity (v). This region is frequently referred to as the "1/v region," because the absorption cross section is proportional to 1/v, which is the reciprocal of neutron velocity. Following the 1/v region, there occurs the "resonance region" in which the cross sections rise sharply to high values called "resonance peaks" for neutrons of certain energies, and then fall again. These energies are called resonance energies and are a result of the affinity of the nucleus for neutrons whose energies closely match its discrete, quantum energy levels. That is, when the binding energy of a neutron plus the kinetic energy of the neutron are exactly equal to the amount required to raise a compound nucleus from its ground state to a quantum level, resonance absorption occurs.
Mean Free Path
Calculation of Macroscopic Cross Section and Mean Free Path
Effects of Temperature on Cross Section
Neutron Flux
Self-Shielding
Summary
REACTION RATES
Reaction Rates
Reactor Power Calculation
Relationship Between Neutron Flux and Reactor Power
Summary
NEUTRON MODERATION
Neutron Slowing Down and Thermalization
Macroscopic Slowing Down Power
Moderating Ratio
Summary
PROMPT AND DELAYED NEUTRONS
Neutron Classification
Neutron Generation Time
Summary
NEUTRON FLUX SPECTRUM
Prompt Neutron Energies
Prompt Neutron Energies
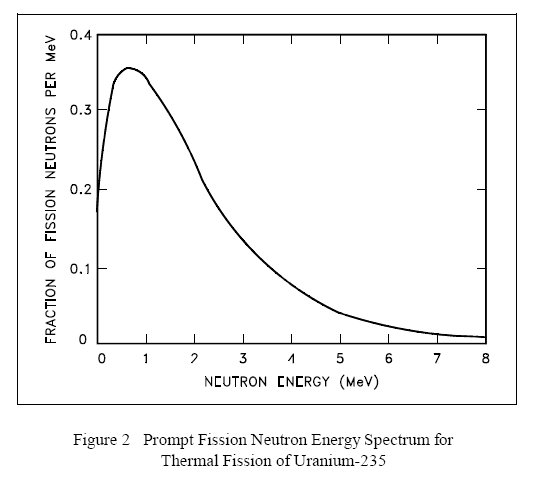
The neutrons produced by fission are high energy neutrons, and almost all fission neutrons have energies between 0.1 MeV and 10 MeV. The neutron energy distribution, or spectrum, may best be described by plotting the fraction of neutrons per MeV as a function of neutron energy, as shown in Figure 2. From this figure it can be seen that the most probable neutron energy is about 0.7 MeV. Also, from this data it can be shown that the average energy of fission neutrons is about 2 MeV. Figure 2 is the neutron energy spectrum for thermal fission in uranium-235. The values will vary slightly for other nuclides.
Thermal and Fast Breeder Reactor Neutron Spectra
Most Probable Neutron Velocities
Summary
Module 3 - Reactor Theory (Nuclear Parameters)
-Explanation- This module explains the nuclear parameters associated with reactor theory. Topics include the neutron life cycle, reactivity and reactivity coefficients, neutron poisons, and control rods.
NEUTRON LIFE CYCLE
Infinite Multiplication Factor, k.
Four Factor Formula
Fast Fission Factor, (e)
Resonance Escape Probability, (p)
Thermal Utilization Factor, (f)
Reproduction Factor, (η)
Effective Multiplication Factor
Fast Non-Leakage Probability (L)
Thermal Non-Leakage Probability (L)
Six Factor Formula
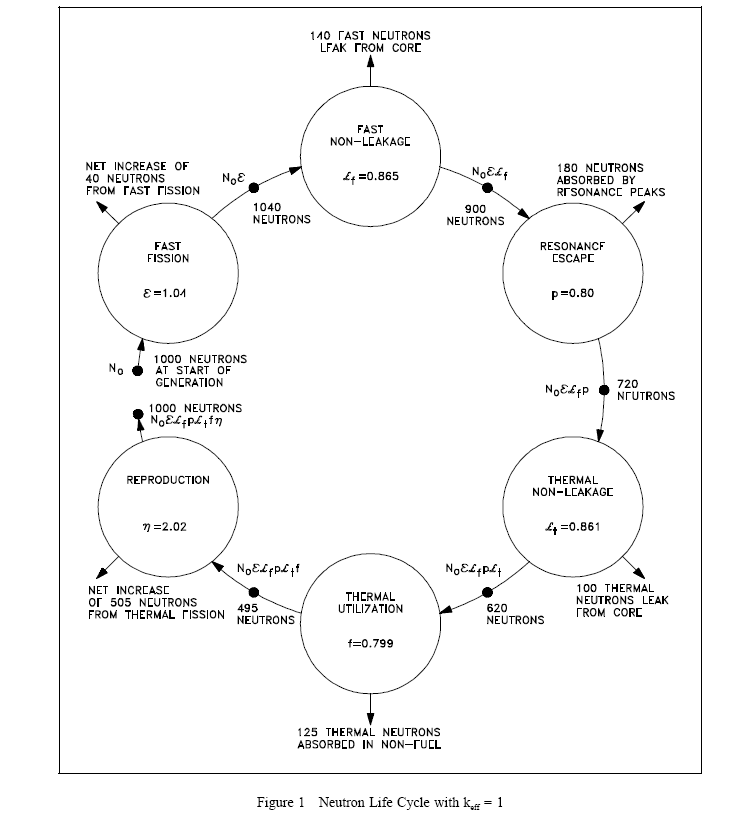
Neutron Life Cycle of a Fast Reactor
Summary
REACTIVITY
Application of the Effective Multiplication Factor
Reactivity
Units of Reactivity
Reactivity Coefficients and Reactivity Defects
Summary
REACTIVITY COEFFICIENTS
Moderator Effects

The moderating ratio is merely the ratio of slowing down power to the macroscopic absorption cross section. The higher the moderating ratio, the more effectively the material performs as a moderator.
Another ratio, the moderator-to-fuel ratio (Nm/Nu), is very important in the discussion of moderators. As the reactor designer increases the amount of moderator in the core (that is, Nm/Nu increases), neutron leakage decreases. Neutron absorption in the moderator (Σm) increases and causes a decrease in the thermal utilization factor. Having insufficient moderator in the core (that is, Nm/Nu decreases) causes an increase in slowing down time and results in a greater loss of neutrons by resonance absorption. This also causes an increase in neutron leakage. The effects of varying the moderator-to-fuel ratio on the thermal utilization factor and the resonance probability are shown in Figure 2.
Moderator Temperature Coefficient
Fuel Temperature Coefficient
Pressure Coefficient
Void Coefficient
Summary
NEUTRON POISONS
Fixed Burnable Poisons
Soluble Poisons
Non-Burnable Poisons
Summary
XENON
Fission Product Poisons
Production and Removal of Xenon-135
Xenon-135 Response to Reactor Shutdown
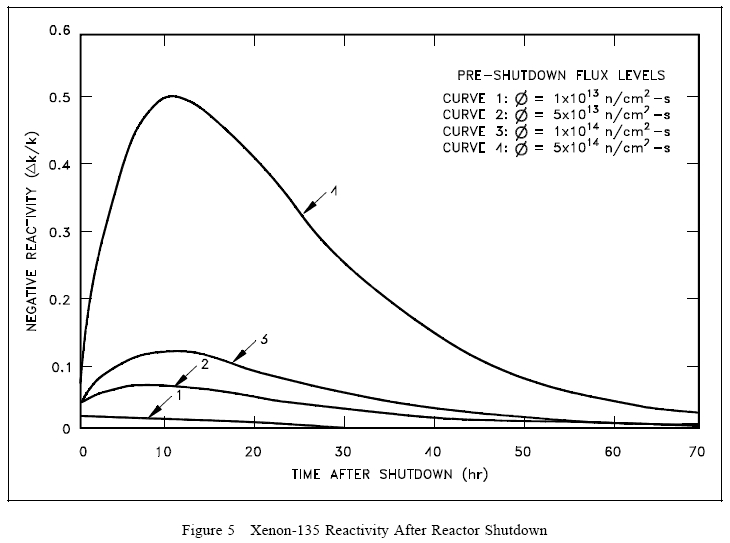
Because the decay rate of iodine-135 is faster than the decay rate of xenon-135, the xenon concentration builds to a peak. The peak is reached when the product of the terms λINI is equal to λXeNXe (in about 10 to 11 hours). Subsequently, the production from iodine decay is less than the removal of xenon by decay, and the concentration of xenon-135 decreases. The greater the flux level prior to shutdown, the greater the concentration of iodine-135 at shutdown; therefore, the greater the peak in xenon-135 concentration after shutdown. This phenomenon can be seen in Figure 5, which illustrates the negative reactivity value of xenon-135 following shutdown from various neutron flux levels.
Xenon-135 Oscillations
Xenon-135 Response to Reactor Power Changes
Summary
SAMARIUM AND OTHER FISSION PRODUCT POISONS
Production and Removal of Samarium-149
Samarium-149 Response to Reactor Shutdown
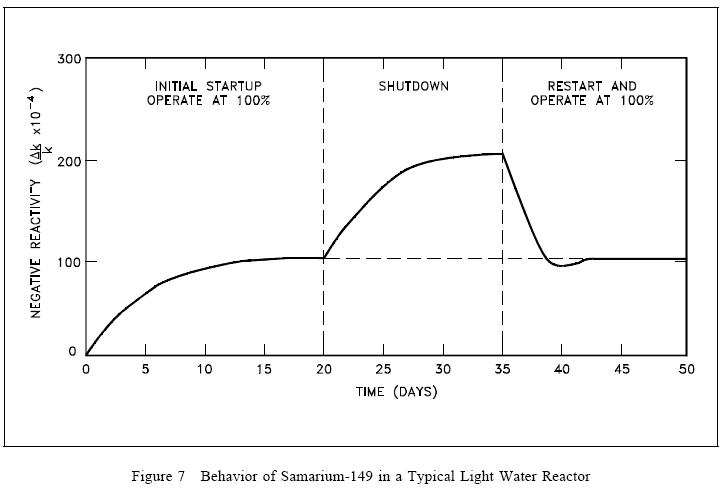
Because samarium-149 is not radioactive and is not removed by decay, it presents problems somewhat different from those encountered with xenon-135, as illustrated in Figure 7. The equilibrium concentration and the poisoning effect build to an equilibrium value during reactor operation. This equilibrium is reached in approximately 20 days (500 hours), and since samarium-149 is stable, the concentration remains essentially constant during reactor operation. When the reactor is shutdown, the samarium-149 concentration builds up as a result of the decay of the accumulated promethium-149. The buildup of samarium-149 after shutdown depends upon the power level before shutdown. Samarium-149 does not peak as xenon-135 does, but increases slowly to a maximum value as shown in Figure 7. After shutdown, if the reactor is then operated at power, samarium-149 is burned up and its concentration returns to the equilibrium value. Samarium poisoning is minor when compared to xenon poisoning. Although samarium-149 has a constant poisoning effect during long-term sustained operation, its behavior during initial startup and during post-shutdown and restart periods requires special considerations in reactor design.
The xenon-135 and samarium-149 mechanisms are dependent on their very large thermal neutron cross sections and only affect thermal reactor systems. In fast reactors, neither these nor any other fission products have a major poisoning influence.
Other Neutron Poisons
Summary
CONTROL RODS
Election of Control Rod Materials
Types of Control Rods
Control Rod Effectiveness
Control Rod Effectiveness
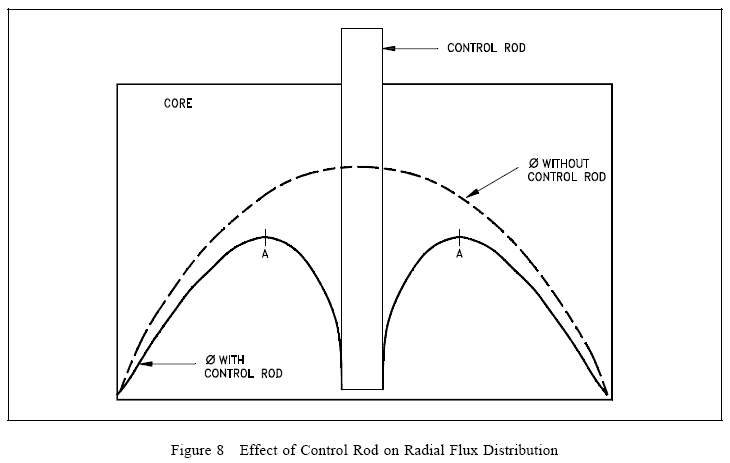
The effectiveness of a control rod depends largely upon the value of the ratio of the neutron flux at the location of the rod to the average neutron flux in the reactor. The control rod has maximum effect (inserts the most negative reactivity) if it is placed in the reactor where the flux is maximum. If a reactor has only one control rod, the rod should be placed in the center of the reactor core. The effect of such a rod on the flux is illustrated in Figure 8.
If additional rods are added to this simple reactor, the most effective location is where the flux is maximum, that is, at point A. Numerous control rods are required for a reactor that has a large amount of excess reactivity (that amount of reactivity in excess of that needed to be critical). The exact amount of reactivity that each control rod inserts depends upon the reactor design. The change in reactivity caused by control rod motion is referred to as control rod worth.
Integral and Differential Control Rod Worth
Rod Control Mechanisms
Summary
Module 4 - Reactor Theory (Reactor Operations)
-Explanation- This module introduces the reactor operations aspect of reactor theory. Topics include subcritical multiplication, reactor kinetics, and reactor operation.
SUBCRITICAL MULTIPLICATION
Subcritical Multiplication Factor
Effect of Reactivity Changes on Subcritical Multiplication
Use of 1/M Plots
Summary
REACTOR KINETICS
Reactor Period (τ)
Effective Delayed Neutron Fraction
Effective Delayed Neutron Precursor Decay Constant
 |
 |
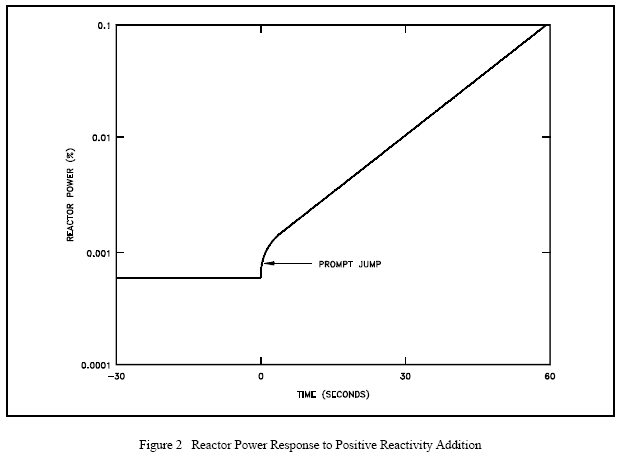
If the positive reactivity added is less than the value of eff, the emission of prompt fission neutrons alone is not sufficient to overcome losses to non-fission absorption and leakage. If delayed neutrons were not being produced, the neutron population would decrease as long as the reactivity of the core has a value less than the effective delayed neutron fraction. The positive reactivity insertion is followed immediately by a small immediate power increase called the prompt jump. This power increase occurs because the rate of production of prompt neutrons changes abruptly as the reactivity is added. Recall from an earlier module that the generation time for prompt neutrons is on the order of 10-13 seconds. The effect can be seen in Figure 2. After the prompt jump, the rate of change of power cannot increase any more rapidly than the built-in time delay the precursor half-lives allow. Therefore, the power rise is controllable, and the reactor can be operated safely.
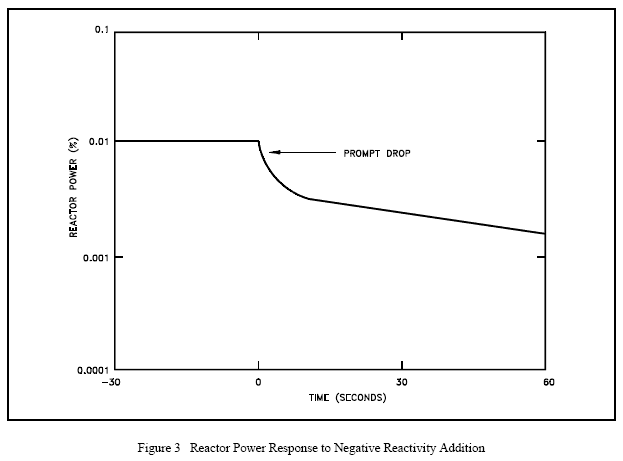
Conversely, in the case where negative reactivity is added to the core there will be a prompt drop in reactor power. The prompt drop is the small immediate decrease in reactor power caused by the negative reactivity addition. The prompt drop is illustrated in Figure 3. After the prompt drop, the rate of change of power slows and approaches the rate determined by the delayed term of Equation (4-7).
Prompt Criticality
Stable Period Equation
Reactor Startup Rate (SUR)
Doubling Time
Summary
REACTOR OPERATION
Startup
Estimated Critical Position
Core Power Distribution
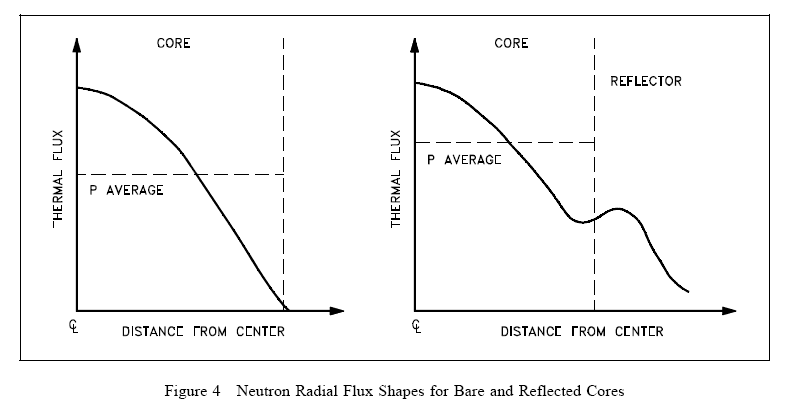
Figure 4 shows the general effect of reflection in the thermal reactor system where core power is proportional to the thermal flux. Notice that a reflector can raise the power density of the core periphery and thus increase the core average power level without changing the peak power. As illustrated in Figure 4, the thermal flux in the reflector may actually be higher than that in the outermost fuel since there are very few absorptions in the reflector
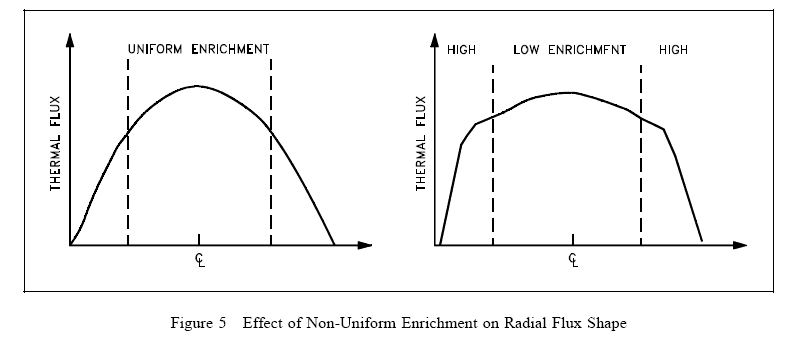
Varying the fuel enrichment or fuel concentrations in the core radially, axially, or both, can readily be used to control power distribution. The simplified example illustrated in Figure 5 shows the effect of using a higher enrichment in the outer regions of the core. Varying fuel concentrations or poison loading for flux shaping is frequently referred to as zoning. In the example illustrated the large central peak is reduced, but the average power level remains the same.
Power Tilt
Shutdown Margin
Operation
Temperature
Pressure
Power Level
Flow
Core Burnup
Shutdown
Decay Heat
Summary

DOE Fundamentals Handbook - Nuclear Physics and Reactor Theory
The Nuclear Physics and Reactor Theory Fundamentals Handbook contains elaborate discussions on Atomic and Nuclear Physics, Neutron Characteristics, Reactor Theory and Nuclear Parameters and the Theory of Reactor Operation. The information in the handbook is presented to provide a foundation for applying engineering concepts. It presents more than enough information to provide YOU with a fundamental knowledge level sufficient to really understand basic concepts of atomic physics, including the atomic nature of matter, Radioactive Decay, fission, the Neutron Life Cycle, Reactor Kinetics, as well as the interaction of radiation with matter and much, much more.

